

India's Income inequality explained..
Monthly Income of Indians...(Various brackets)
EARNING
India’s income distribution tells a powerful story—not just about money, but about opportunity, inequality, and aspiration. The income pyramid shown in the image presents a clear snapshot of how much different sections of India earn per month in 2026, and the gap between the top and the bottom is both striking and revealing.
Understanding the Pyramid
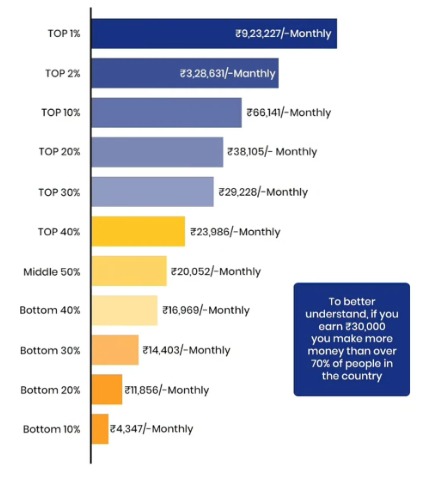
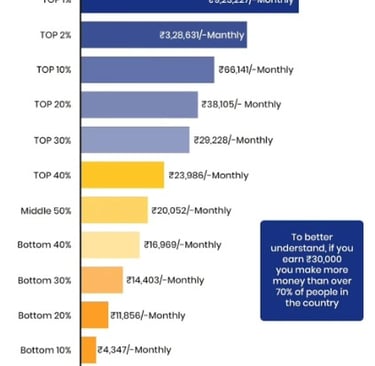
The pyramid divides India’s population into income brackets—from the bottom 10% to the top 1%—and shows their average monthly income. As expected, the pyramid narrows sharply at the top, highlighting how wealth concentrates among a small percentage of people.
Monthly Income Breakdown (India, 2026)
🔝 Upper Income Groups
Top 1%: ₹9,23,227 per month
Top 2%: ₹3,28,631 per month
Top 10%: ₹66,141 per month
This shows how steep income growth becomes once someone enters the top layers. The jump from the top 10% to the top 1% is enormous, underlining how elite the highest earners truly are.
📊 Upper-Middle & Middle Class
Top 20%: ₹38,105 per month
Top 30%: ₹29,228 per month
Top 40%: ₹23,986 per month
Middle 50%: ₹20,052 per month
This section represents India’s aspirational working class—salaried employees, small business owners, and professionals. Interestingly, the difference between the middle 50% and top 40% is not very large, suggesting limited upward mobility within the middle-income range.
🔻 Lower Income Groups
Bottom 40%: ₹16,969 per month
Bottom 30%: ₹14,403 per month
Bottom 20%: ₹11,856 per month
Bottom 10%: ₹4,347 per month
For the bottom layers, survival itself is a challenge. At ₹4,347 per month, the bottom 10% struggle to meet basic needs like food, housing, healthcare, and education.
The Most Important Insight
One striking message from the image says:
To better understand, if you earn ₹30,000 per month, you make more than over 70% of people in the country.
This single line challenges common perception. Many people earning ₹25,000–₹30,000 feel financially stressed, yet statistically, they are already ahead of a vast majority of the population.
What This Pyramid Tells Us
1. Income Inequality Is Sharp
The top 1% earns more than 200 times what the bottom 10% earns monthly. This is not just inequality—it’s a structural divide.
2. Middle-Class Pressure Is Real
Despite earning more than most, the middle class faces high living costs, EMIs, taxes, and inflation, making financial comfort elusive.
3. Moving Up the Pyramid Is Hard
The income jump becomes meaningful only after crossing into the top 20%. Below that, progress is slow and incremental.
Why This Matters for Individuals
Understanding where you stand in the income pyramid helps you:
Set realistic financial goals
Appreciate progress instead of constant comparison
Focus on skill-building, investing, and income growth
Final Thoughts
India’s 2026 income pyramid reveals a country of contrasts—where a small group earns extraordinarily high incomes while a large population survives on modest means. Recognizing this reality isn’t about discouragement; it’s about awareness.
In a nation this unequal, financial literacy, skill development, and long-term investing are not optional—they are essential tools for climbing the pyramid.
Help
Questions? Reach out anytime.
reachus@69waystoinvest.com
© 2026. All rights reserved.
Our Team-
Shrinivas B(MBA)
Ravi (MBA)
Prasad (Mcom)